[Analytics -> Report] Dashboard Capabilities
 Hi Team,
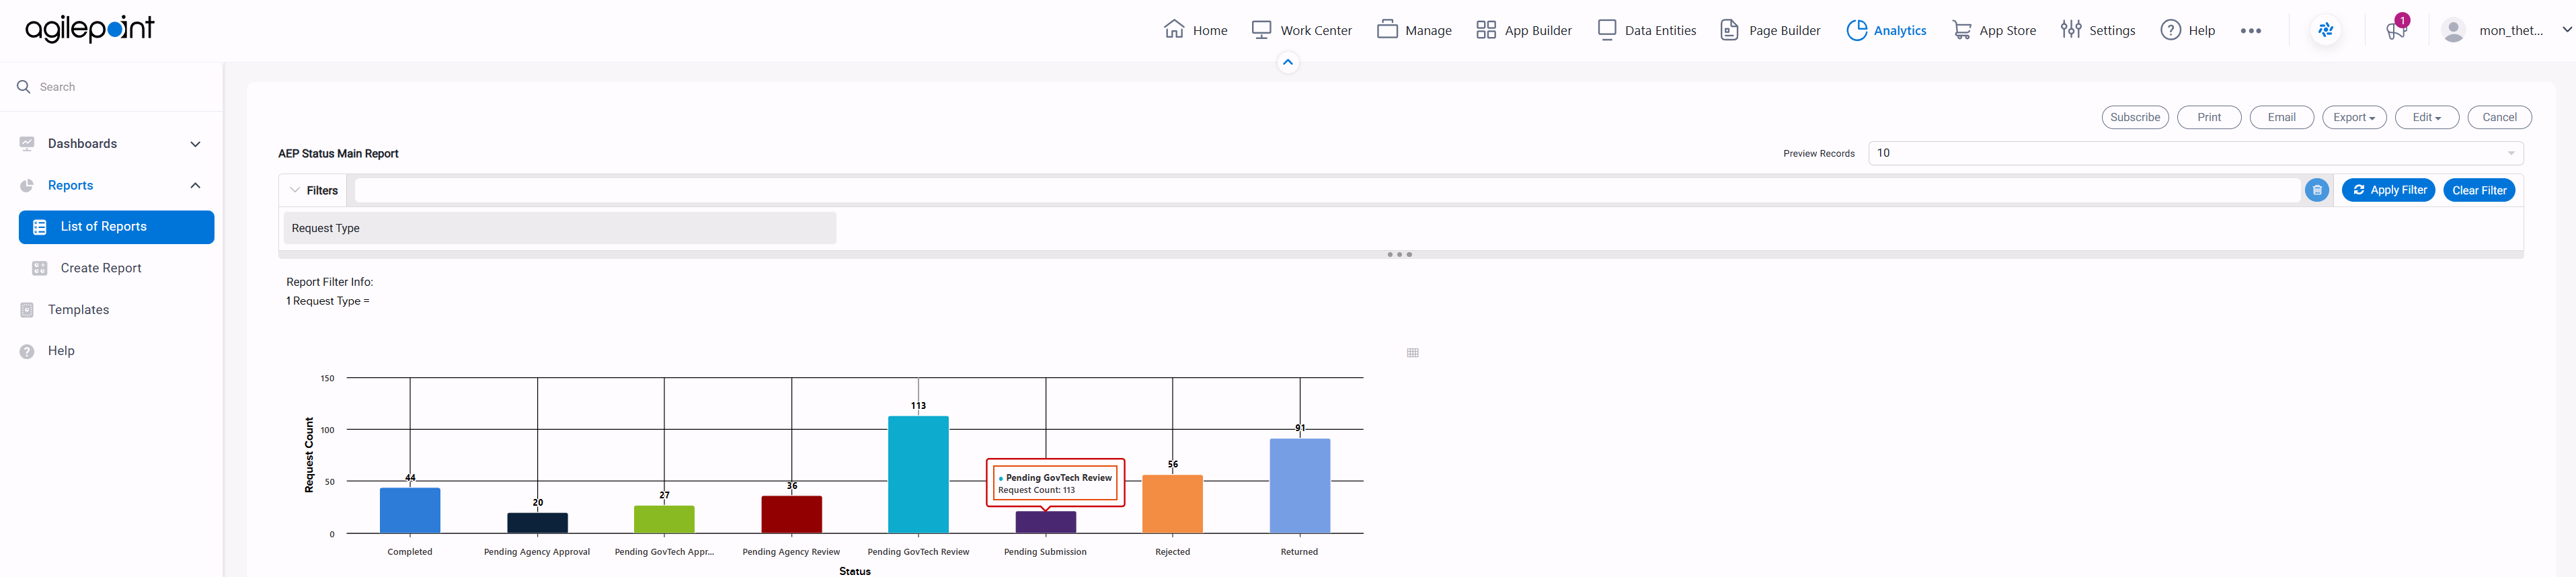
As seen from screenshot, the above is the current report view that I have configured in AgilePoint. I want to check if its possible to do a visualization with icons and numbers as seen below: 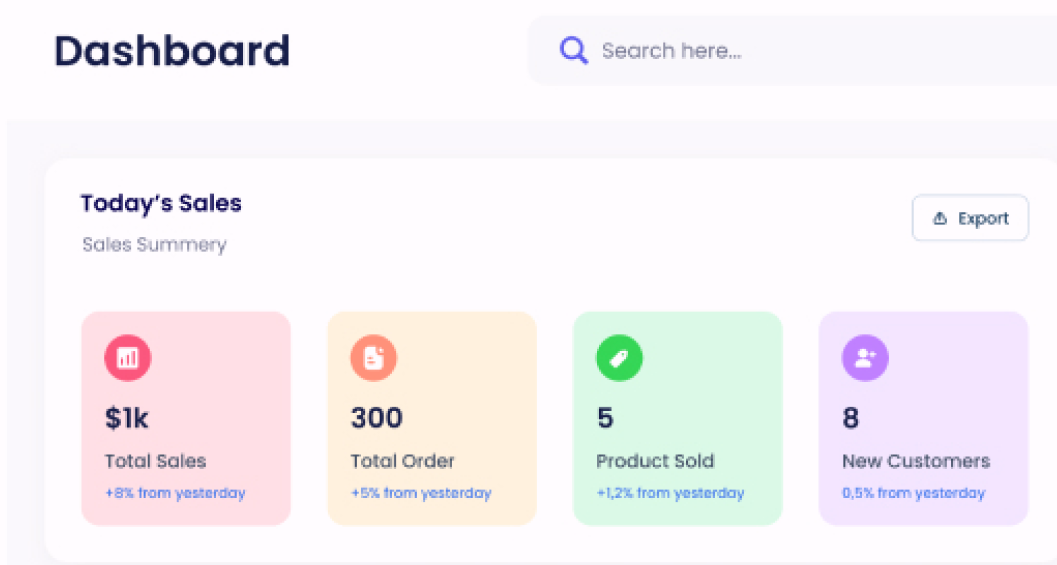 If this can be done, can I get your help to provide me the steps to configure this and add to the dashboard view of my current report?
-

Hello Jordan,
If the requirement is to display the metric value along with an icon and descriptive text, this can be considered within the available KPI reporting.
A KPI Report Part can contain:
- Metric/value — e.g. 1K, 300, 5, 8
- Text — e.g. Total Sales, Total Order
- Images — which can be used for icons
Here are the steps to create KPI Report
- Create Report
- Select Data Source
- Select Design
- Select Report Type "KPI"
Here is the documentation link to create KPI report part
https://blog.agilepoint.com/analytics-center-overview-part-15-kpi-report-part/
Here is the documentation link for the Analytics and Reporting with additional details
https://blog.agilepoint.com/category/analytics-and-reporting/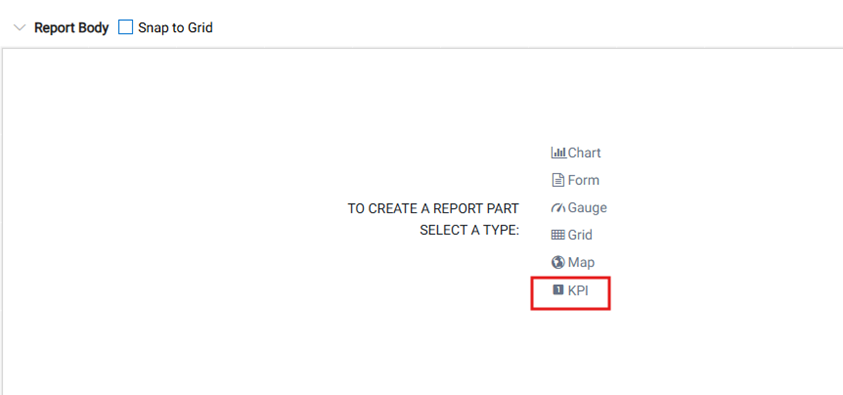
-

Hello!
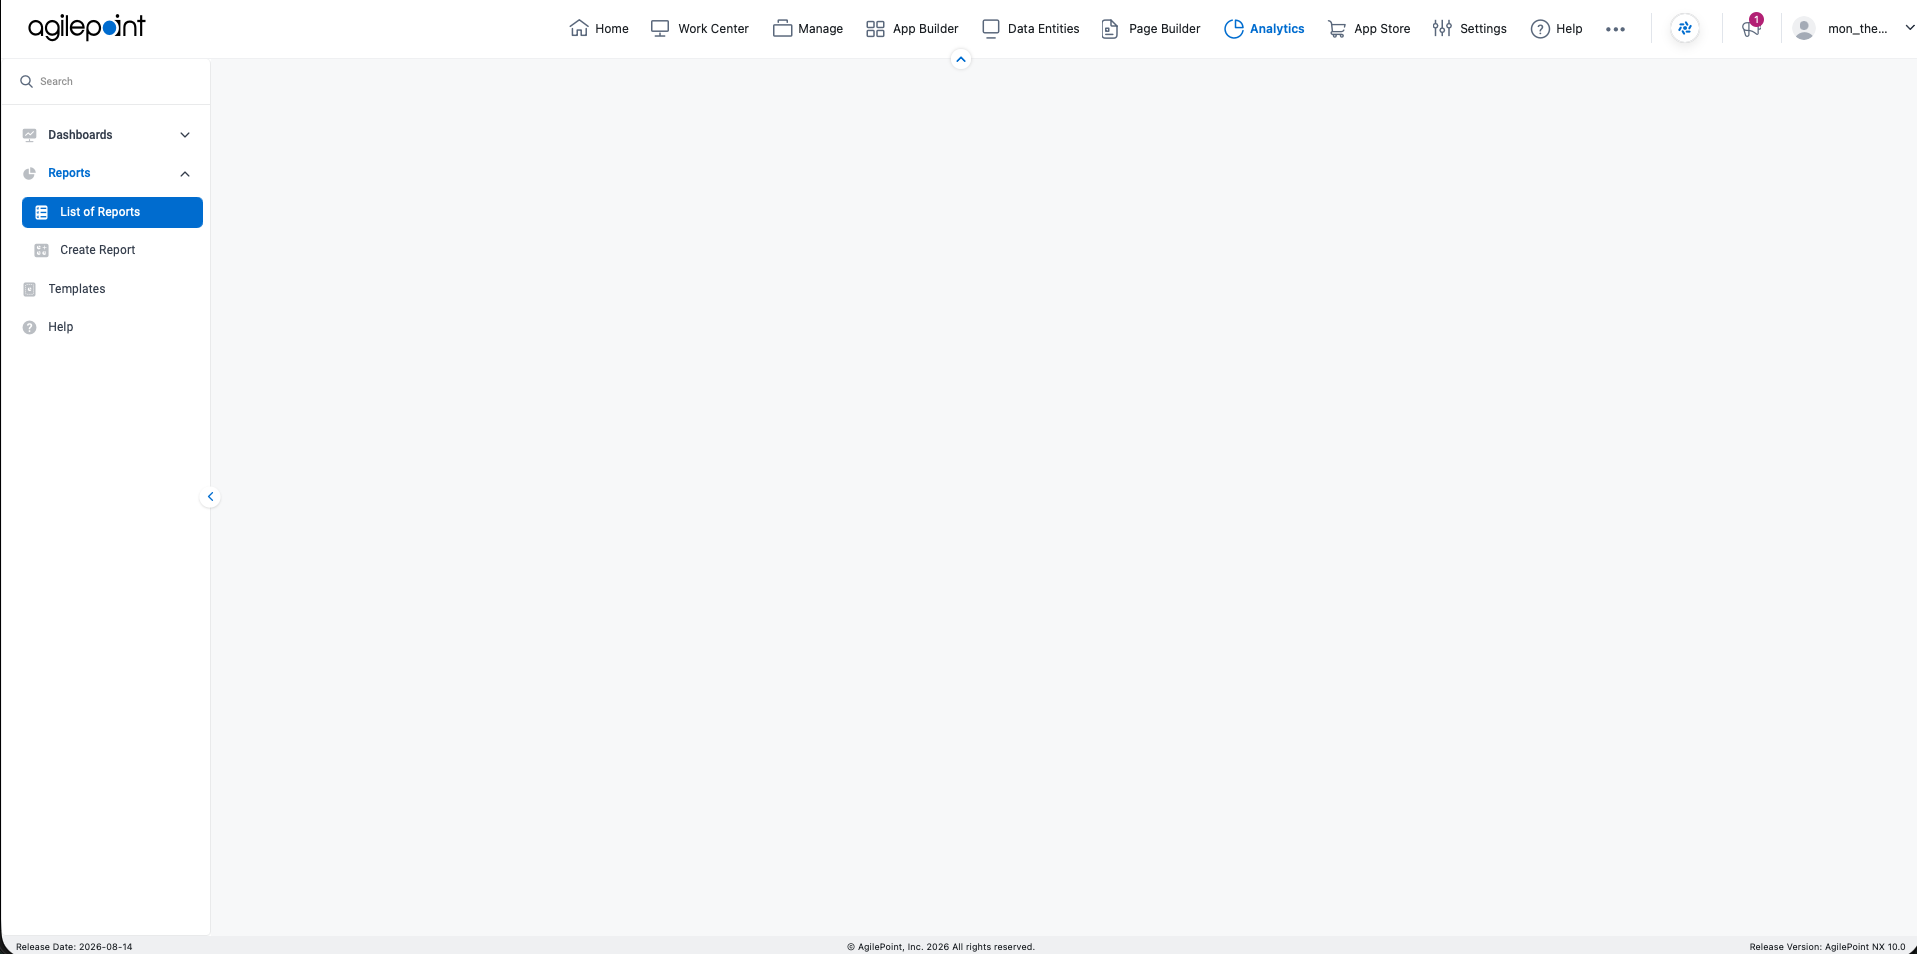
I still see a blank screen.
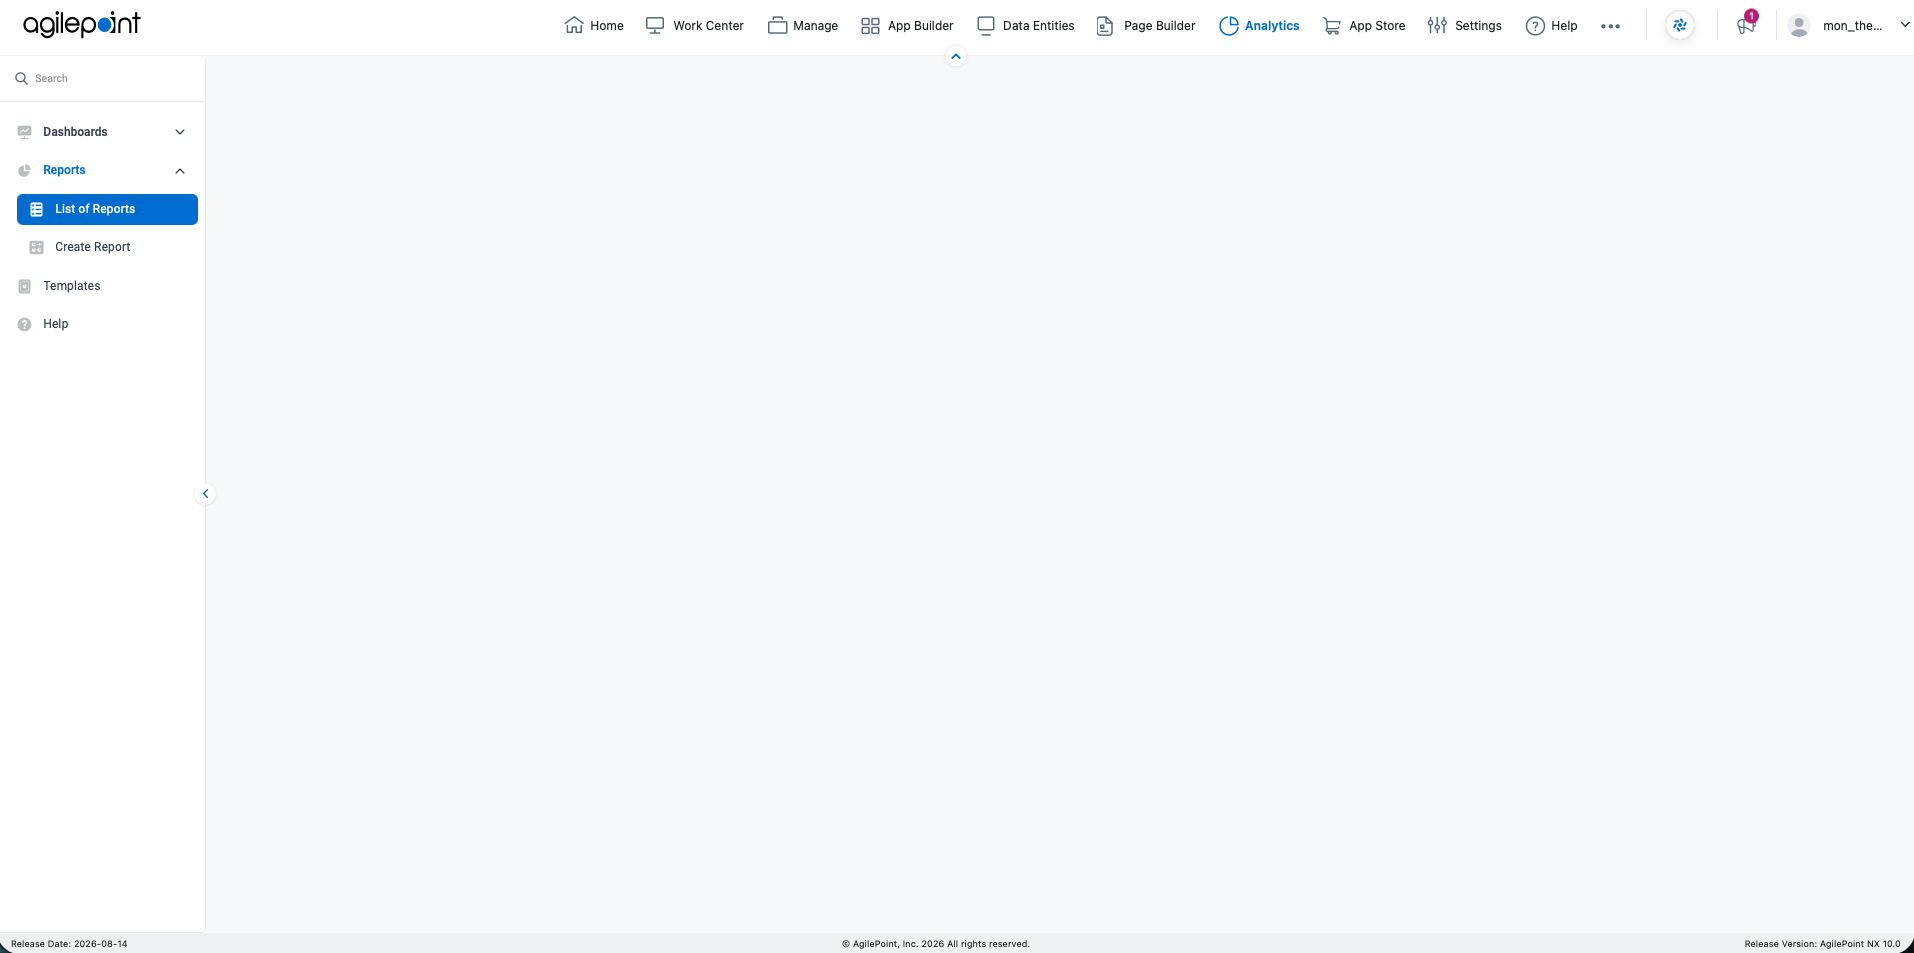
I am accessing the sandbox environment.
https://govtech.sandbox.agilepoint.com/analytics/myreports#?source=/analytics/report/list/0
-

Hello Jordan,
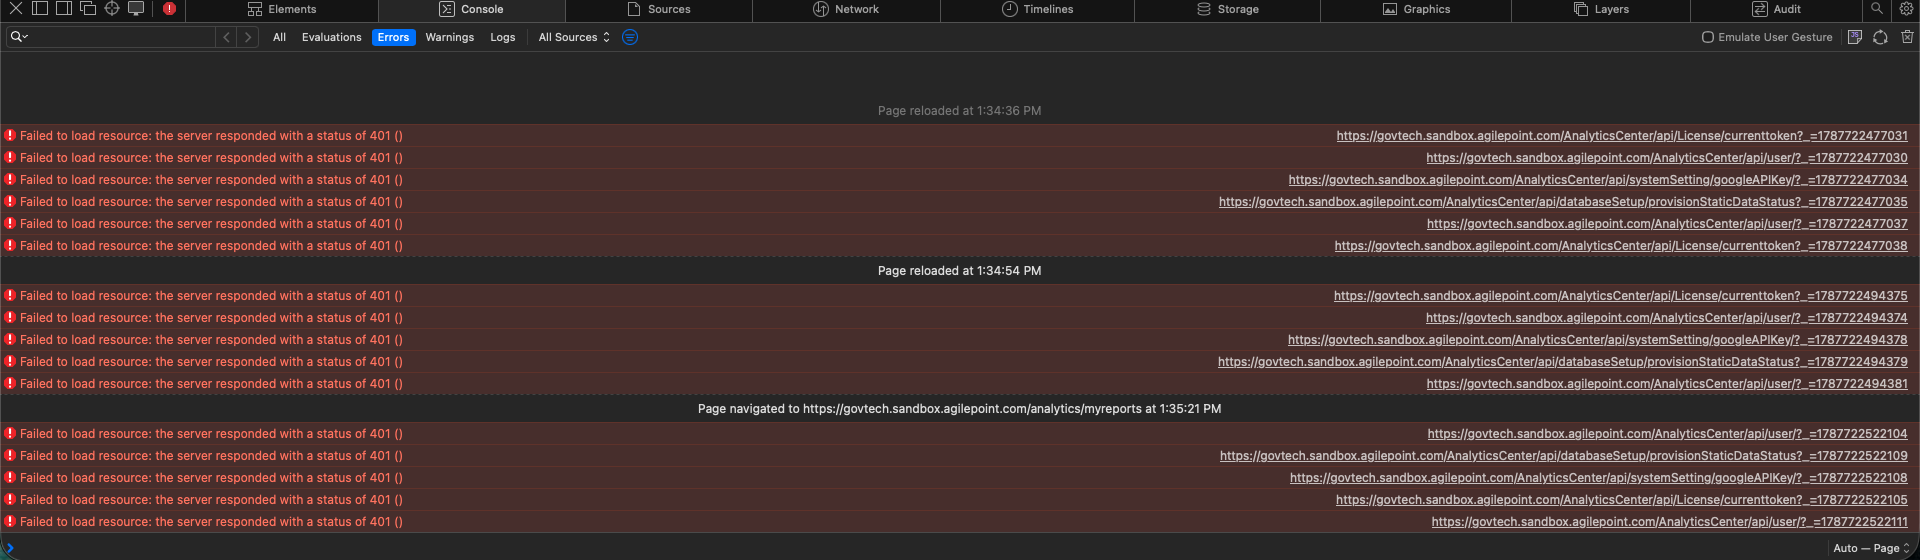
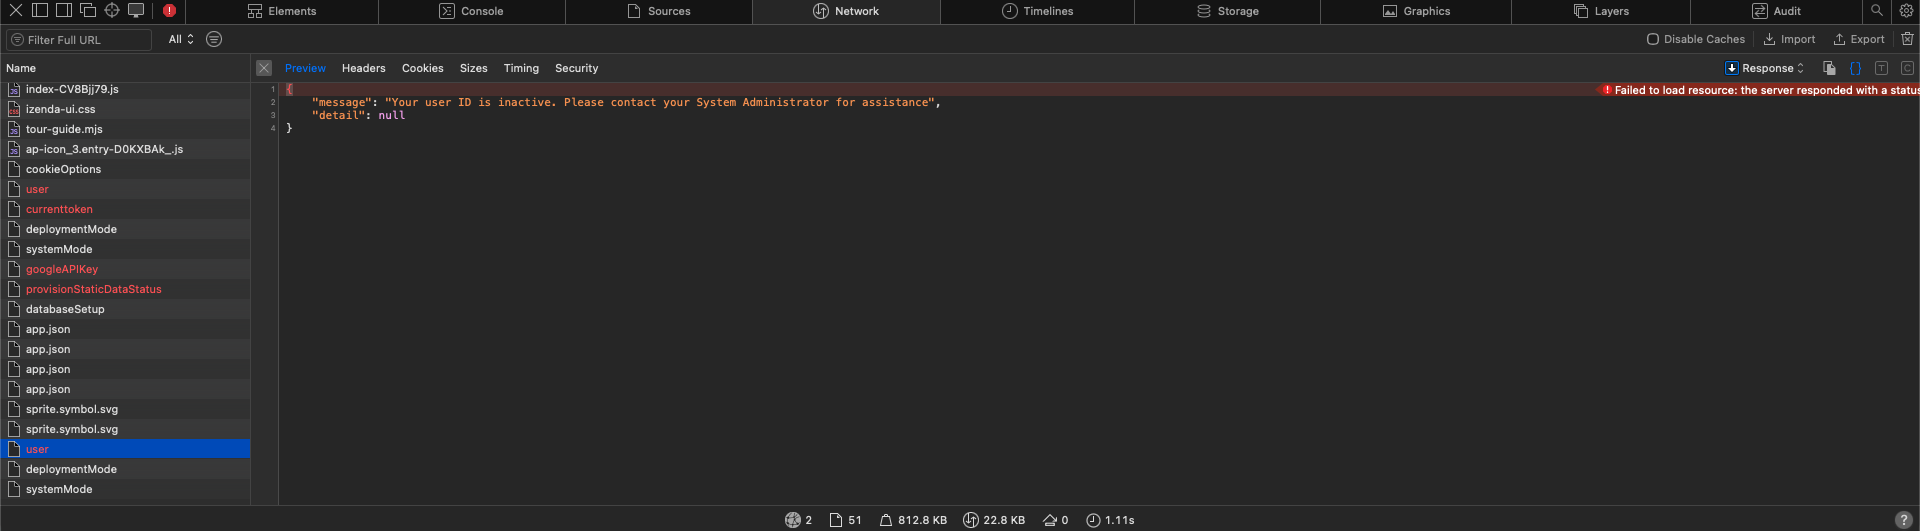
Thanks for sharing the screen capture.Could you please share the screen captures from the Network and Console tabs from the browser Developer Tools.
Steps to capture the Network tab
- Open the affected screen/page where the issue occurs.
- Press F12 or right-click on the page and select Inspect.
- Select the Network tab.
- Enable Preserve log if available.
- Clear the existing network logs by clicking the Clear (🗑) icon.
- Reload the page by pressing Ctrl + F5.
- Reproduce the issue.
- Check whether any requests are showing red/failed status
- Take a screenshot showing the failed request(s) and the corresponding details.
Steps to capture the Console tab
- In the same Developer Tools window, select the Console tab.
- Clear the existing messages.
- Reload the page and reproduce the issue.
- Check for any red error messages.
- Take a screenshot of the errors displayed in the Console.
Please share both the Network and Console screenshots with us so that we can investigate the issue further.
Regards,
Aravind
Please sign in to leave a comment.
Comments
6 comments